Section 7.1: What is Probability?
Such unpredictability can be useful sometimes! For example, in a cricket match, the fact that a coin is tossed to decide which team will bat first is considered to be a fair method. Can you explain why?
A coin toss is considered a fair method because it represents a random experiment. In a random experiment, every outcome has a chance to occur, but we cannot predict the exact result in advance. Assuming the coin is fair and unbiased, the theoretical probability of getting heads is
Ask your friend to predict the outcome of a ₹1 coin you toss. Do you see that your friend could guess heads or tails but could not know for certain? That's randomness! All possible results are known, but each individual try is unpredictable.
This is an activity-based observation. When you flip a coin, the complete sample space of possible outcomes (Heads or Tails) is fully known. However, because of the complex physical factors involved in the toss (like the force applied or the angle of the flip), we cannot predict the exact outcome of a single, individual flip with absolute certainty. This unpredictability on an individual try is the definition of randomness.
Exercise Set 7.1 (Page 159)
Rank the following events on a scale from 0 (Impossible) to 1 (Certain). Label each event: Impossible, less likely, equally likely (even chance), more likely, certain. Give reasons why you gave each event its ranking.
(i) The next Monday will come after Sunday.
- Ranking: Certain (1)
- Reason: The days of the week follow a globally fixed and universally accepted sequence. Monday always follows Sunday without exception.
- (ii) It will snow in Mumbai in July.
- Ranking: Impossible (0)
- Reason: Mumbai has a tropical climate, and July falls directly in the middle of the monsoon season, which is characterized by heavy rainfall and warm temperatures. These atmospheric conditions make snow meteorologically impossible.
- (iii) An elephant will walk through your classroom today.
- Ranking: Impossible (0)
- Reason: Classrooms are not natural habitats or pathways for elephants. Furthermore, standard school infrastructure is not built to accommodate the entry of an elephant, making the event practically impossible.
- (iv) You will greet at least one friend at school tomorrow.
- Ranking: More likely (Closer to 1)
- Reason: Assuming it is a regular school day and you are attending, there is a very high probability that you will see and greet at least one friend. It is not an absolute certainty (for instance, you or all your friends might happen to be absent), but the chances are heavily in favour of it happening.
Section 7.2: Measuring Probability Objectively
7.2.1 Experimental Probability: Performing Observations or Experiments
Identify the sample space for tossing a coin, and for rolling a die.
- The sample space is the complete list of all possible outcomes for an experiment.
- When tossing a single coin, there are only two possible outcomes: Heads (H) or Tails (T). Therefore, the sample space is {H, T}.
- When rolling a standard 6-sided die, the possible faces that can land facing up are 1, 2, 3, 4, 5, or 6. Therefore, the sample space is {1, 2, 3, 4, 5, 6}.
Suppose you roll a die 50 times, and it lands on a 4 exactly 8 times. Find the experimental probability of rolling a 4.
- Experimental probability is found using real data from an actual experiment. The formula is the number of times the specific event occurred divided by the total number of trials.
- The event "rolling a 4" happened 8 times.
- The total number of trials (rolls) is 50.
- The experimental probability is 8 / 50. We can simplify this fraction to 4 / 25, which equals 0.16 or 16%.
7.2.2 Theoretical Probability
If you roll a standard 6-sided die, what is the theoretical probability of getting a 4?
- Theoretical probability is what we expect to happen in a perfectly fair situation without having to do an experiment. It is calculated by dividing the number of favourable outcomes by the total number of possible outcomes.
- The favourable outcome is getting a 4. There is only 1 side with a 4 on it, so there is 1 favourable outcome.
- The total possible outcomes are 6 (the numbers 1 through 6).
- The theoretical probability is 1 / 6. Converted to a decimal, this is approximately 0.167 or 16.7%.
A letter is picked at random from the word 'PROBABILITY'. What is the probability of picking the letter B?
- First, we count the total number of letters in the word "PROBABILITY". There are 11 letters in total, so there are 11 possible outcomes.
- Next, we count how many times our favourable outcome, the letter "B", appears. The letter "B" appears 2 times.
- The theoretical probability is the number of favourable outcomes divided by the total possible outcomes. This gives us 2 / 11. Converted to a decimal, this is approximately 0.182 or 18.2%.
7.2.3 Analysing Statistical Data Using Probability
Suppose you anonymously collect information regarding the favourite fruit of 50 students in your class. The results are: 20 students like mango, 15 students like apples, 10 students like bananas, and 5 students like grapes. What's the probability that a randomly picked student's favourite fruit is mango? Also, estimate how many mangoes you need to purchase for a school of 1500 students based on this data.
- To find the statistical probability that a randomly chosen student likes mangoes, we divide the number of students who like mangoes by the total number of students surveyed. The data shows 20 students like mangoes out of a total of 50 students.
- The probability is 20 / 50, which simplifies to 2 / 5, or 0.4 (40%).
- To estimate how many mangoes to buy for the whole school of 1500 students, we apply this 40% rate to the entire school population. We calculate 40% of 1500, which is 0.4 * 1500 = 600. So, you would need to buy approximately 600 mangoes.
If I have rolled a 4 on a die 8 times in succession, the probability of rolling a 4 again is still only approximately 0.16 (assuming the die is fair). Probability does not tell you what will happen next but predicts what will happen in the long run.
This reflects an important rule about independent events. Each roll of a die is separate from the previous ones. The die has no "memory" of what it rolled before. Therefore, the chance of rolling a 4 remains exactly 1 out of 6 (about 0.16 or 16.6%) on the 9th roll, regardless of the 8 previous rolls.
Let us say you are playing Snakes and Ladders, and you are rolling a fair 6-sided die to move. You have just rolled the die three times in a row, and each time you got a 6. Now, you think: 'I have already rolled three 6s—there is no way I will get a 6 again on the next roll!' Why is this thinking the Gambler's Fallacy?
This is an example of the Gambler's Fallacy because it incorrectly assumes that past results will somehow affect the next result. Rolling a die is an independent event; the die does not remember that it just landed on 6 three times. The theoretical probability of getting a 6 on the very next roll remains exactly 1 / 6 (approximately 16.6%). The chance does not go down just because you had a recent streak of 6s.
Exercise Set 7.2 (Pages 165-166)
A teacher mixes a large bag of sweets of different colours and randomly selects a sample of 30 sweets. She counts the number of sweets of each colour: 10 red sweets, 8 green sweets, 7 yellow sweets, 5 blue sweets.
(i) Calculate the probability that a randomly picked sweet from the sample is green.
(ii) If there are 600 sweets in total in the large bag, estimate how many are likely to be yellow, based on the sample results.
(i) Experimental probability is calculated by dividing the number of times an event occurred by the total number of trials in the sample. The total number of sweets in the sample is 30. The number of green sweets is 8. The probability is 8 / 30, which simplifies to
(ii) First, find the probability of picking a yellow sweet from the sample. There are 7 yellow sweets out of 30, so the probability is
A survey is conducted at a school where a random sample of 40 students is asked about their favourite club. The responses are: 14 students: Science Club, 11 students: Arts Club, 9 students: Sports Club, 6 students: Debate Club. Assume there are 800 students in the whole school.
(i) What is the probability that a randomly chosen student from the sample prefers the Arts Club?
(ii) Using the sample results, estimate how many students in the whole school are likely to prefer the Sports Club.
(i) The total number of students in the sample is 40. The number of students who prefer the Arts Club is 11. Therefore, the probability is
(ii) From the sample, 9 out of 40 students prefer the Sports Club. The probability is
Toss a coin 20 times and record the result each time (heads or tails).
(i) How many times did you get heads?
(ii) How many times did you get tails?
(iii) Calculate the experimental probability of getting heads.
(iv) If you toss the coin once more, what is the probability of getting tails?
Because this is an activity you perform yourself, your exact answers for parts (i), (ii), and (iii) will naturally vary. Below is an example of how to answer based on a hypothetical experiment.
Let's assume you tossed the coin 20 times and got 12 heads and 8 tails.
(i) 12 (Note: Your actual recorded count may vary).
(ii) 8 (Note: Your actual recorded count may vary).
(iii) The experimental probability is the number of heads divided by the total number of tosses. In our example, this is 12 / 20, which simplifies to
(iv) The probability of getting tails on the next single toss is a theoretical probability. Since past flips do not affect future flips (the coin has no memory), the probability of getting tails remains exactly
Toss a paper cup into the air 100 times. After each toss record whether the cup lands on its bottom, upside down on its top or on its side (See Fig. 7.5). Assign probabilities to the outcomes by using experimental probability.
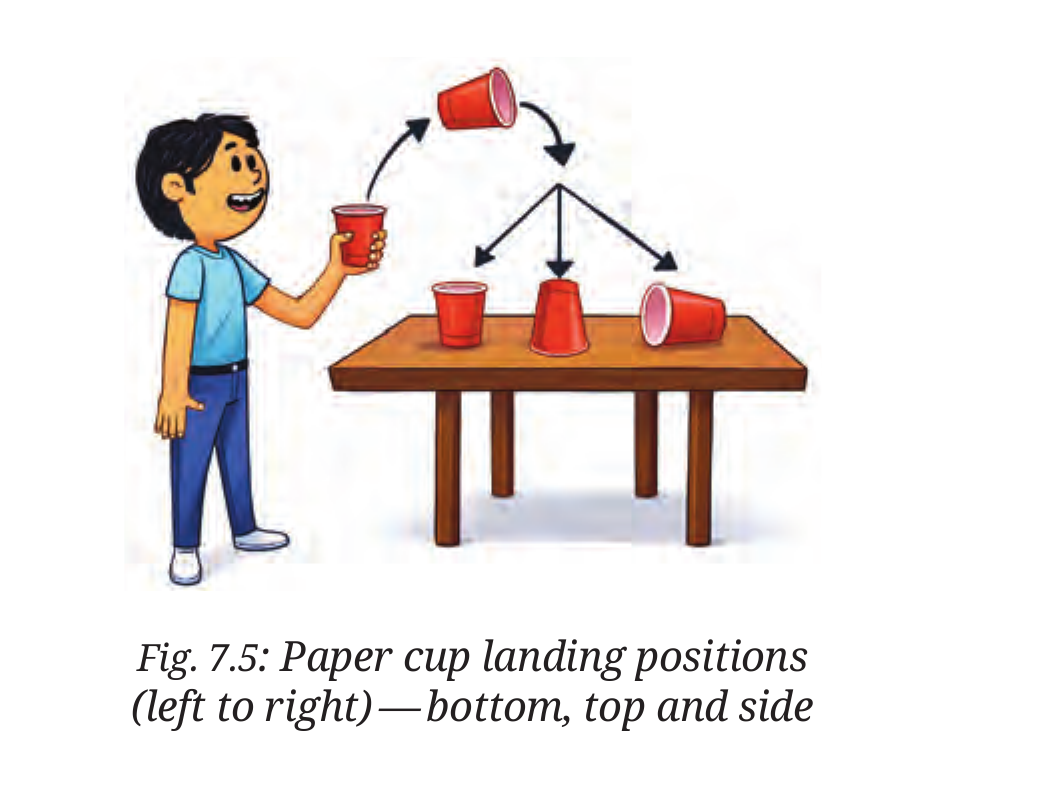
- This is an activity-based question, so your answers will depend entirely on your own experiment. To find the experimental probabilities, divide the number of times each landing position occurred by your total number of tosses (100). For example, if your cup landed on its bottom 15 times, upside down on its top 5 times, and on its side 80 times, your calculated experimental probabilities would look like this:
- Bottom: 15 / 100 =
3 2 0 - Top: 5 / 100 =
1 2 0 - Side: 80 / 100 =
4 5
What is the probability of getting an even number when rolling a fair 6-sided die?
- First, list the total sample space for a 6-sided die: {1, 2, 3, 4, 5, 6}. There are 6 possible outcomes in total.
- Next, list the favourable outcomes (the even numbers): {2, 4, 6}. There are 3 favourable outcomes.
- The theoretical probability is the number of favourable outcomes divided by the total possible outcomes. This gives 3 / 6, which simplifies to
1 2
Suppose you roll a 6-sided die 12 times and get a '3' three times.
(i) What is the experimental probability of rolling a '3'?
(ii) What is the theoretical probability of rolling a '3'?
(iii) Why might these probabilities be different? What would you expect to happen if you roll the die 60, 600, or 6000 times?
(i) The experimental probability is based on the data collected from your trials. You rolled a '3' three times out of 12 rolls. The experimental probability is 3 / 12, which simplifies to
(ii) The theoretical probability is based on analyzing the fair die. There is only one face with a '3' on it, out of 6 possible faces. The theoretical probability is
(iii) These probabilities are different because your experimental sample size is small (only 12 rolls). Short-term randomness means real-life data often differs slightly from the theoretical expectation. However, because of the Law of Large Numbers, if you roll the die 60, 600, or 6000 times, you should expect your experimental probability to steadily get closer and closer to the theoretical probability of
Section 7.3: Elements of Probability: Sample Spaces and Events
7.3.1 Sample Space & 7.3.2 Events
Exercise Set 7.3 (Pages 167-168)
When a single 6-sided die is rolled, what is the total number of possible outcomes in the sample space?
- A standard die has six faces, each showing a different number from 1 to 6. The sample space is the complete list of all these possible results.
- Sample space
𝑆 = { 1 , 2 , 3 , 4 , 5 , 6 } - Counting the items in this set, we find the total number of possible outcomes is 6.
For the following experiments write down the sample space
(i) Rolling a die and tossing a coin together.
- A die has 6 possible outcomes:
{ 1 , 2 , 3 , 4 , 5 , 6 } - A coin has 2 possible outcomes:
{ H e a d s ( H ) , T a i l s ( T ) } - To find the combined sample space, we pair each number from the die with each side of the coin.
𝑆 = { ( 1 , 𝐻 ) , ( 1 , 𝑇 ) , ( 2 , 𝐻 ) , ( 2 , 𝑇 ) , ( 3 , 𝐻 ) , ( 3 , 𝑇 ) , ( 4 , 𝐻 ) , ( 4 , 𝑇 ) , ( 5 , 𝐻 ) , ( 5 , 𝑇 ) , ( 6 , 𝐻 ) , ( 6 , 𝑇 ) } - (ii) Choosing a random integer between -5 and +5.
- The word "between" mathematically means we look at the integers strictly inside the range, excluding the endpoints -5 and +5.
- Listing all whole numbers greater than -5 and less than +5 gives us:
𝑆 = { − 4 , − 3 , − 2 , − 1 , 0 , 1 , 2 , 3 , 4 } 𝑆 = { − 5 , − 4 , − 3 , − 2 , − 1 , 0 , 1 , 2 , 3 , 4 , 5 } - If we only care about the final observable colour of the drawn ball, the experiment only has two possible distinct outcomes.
𝑆 = { G r e e n , R e d } 𝐺 1 𝐺 5 𝑅 1 𝑅 7 { G r e e n , R e d }
In a village fair, there are 3 popular snacks available: Samosa, Pakora, and Bhaji. For drinks, villagers can choose either Chai or Lassi.
(i) List the sample space of all possible snack and drink combinations a person could choose at the fair.
(ii) List the event 'Selecting Samosa as a snack.'
- (i) To find all possible combinations, we must pair every individual snack option with every individual drink option.
𝑆 = { ( S a m o s a , C h a i ) , ( S a m o s a , L a s s i ) , ( P a k o r a , C h a i ) , ( P a k o r a , L a s s i ) , ( B h a j i , C h a i ) , ( B h a j i , L a s s i ) } - (ii) An event is a specific subset of the sample space. We need to look at our complete sample space from part (i) and only extract the combinations where the person chose a Samosa.
- Event
𝐸 = { ( S a m o s a , C h a i ) , ( S a m o s a , L a s s i ) }
Section 7.4: Tree Diagrams
Toss a fair coin two times. Draw a tree diagram to list the sample space and find the probability of getting Heads twice.
- Tree Diagram Description: We start from a single point and draw two lines (branches) representing the first toss: one leading to "H" (Heads) and one to "T" (Tails). From that first "H", we draw two more branches representing the second toss: one to "H" and one to "T". We do the same from the first "T", drawing branches to "H" and "T".
- Tracing each path from start to end gives us 4 possible outcomes: HH, HT, TH, TT.
- Sample Space:
𝑆 = { H H , H T , T H , T T } - Probability: The event of getting Heads twice is the single outcome "HH". Because there is 1 favourable outcome out of 4 total possible outcomes, the theoretical probability is 1/4 (or 0.25, which is 25%).
Can you calculate the probability of getting one head and one tail?
- Looking at our sample space
𝑆 = { H H , H T , T H , T T } - The favourable outcomes are "HT" and "TH". There are 2 favourable outcomes.
- The total number of possible outcomes is 4.
- The theoretical probability is 2/4, which simplifies to 1/2 (or 50%).
Exercise Set 7.4 (Page 169)
There are two fruit baskets A and B. Basket A has one apple and two oranges. Basket B has one banana and one mango. You randomly pick one fruit from each basket.
(i) Draw a tree diagram showing all possible pairs of fruits.
(ii) List the sample space.
(iii) What is the probability of picking one apple and one banana?
(i) Tree Diagram: Start from a single point. Draw three branches for Basket A representing each distinct fruit: Apple (A), Orange 1 (O1), and Orange 2 (O2). From each of these three choices, draw two branches for Basket B: one for Banana (B) and one for Mango (M).
(ii) Sample Space: Tracing the branches, we get 6 possible outcomes.
Let us say that you have a box containing 3 red pens, 4 black pens and 2 green pens. You pick a pen (without looking) from the box and put it back. Then your friend does the same.
(i) What are the possible outcomes of the pen colours? Can you draw a tree diagram representing the possible outcomes?
(ii) Can you use the tree diagram to guess the probability that both you and your friend pick pens of the same colour?
- (i) Because we are only looking at the colours (Red, Black, Green), the possible outcomes for a single pick are R, B, and G. Tree Diagram: Start with a single point and draw three branches for your pick: R, B, and G. From each of those, draw three more branches for your friend's pick: R, B, and G. The possible outcomes of the combined colours are:
𝑆 = { R R , R B , R G , B R , B B , B G , G R , G B , G G } - Probability of picking Red is 3/9. Picking Red twice (RR) is (3/9) * (3/9) = 9/81.
- Probability of picking Black is 4/9. Picking Black twice (BB) is (4/9) * (4/9) = 16/81.
- Probability of picking Green is 2/9. Picking Green twice (GG) is (2/9) * (2/9) = 4/81.
- To find the total probability of picking the same colour, we add these together: 9/81 + 16/81 + 4/81 = 29/81.
End-Of-Chapter Exercises (Pages 169-171)
Fill in the blanks.
(i) The probability of an impossible event is _____.
(ii) The set of all possible outcomes of a random experiment is called the _____.
(iii) The probability of an event that is certain to happen is _____.
(iv) Tossing a fair coin has a probability of _____ for getting heads.
(i) 0 (ii) sample space (iii) 1 (iv) 1/2
In a survey of 50 students, 15 students said they liked football. The number of students who like football is 15, and the (frequency/relative frequency) is _____ (fill in the fraction or decimal).
The phrase to circle/select is relative frequency. The relative frequency is calculated as 15 / 50, which simplifies to 3/10 or 0.3.
Which of the following experiments have equally likely outcomes? Explain.
(i) Tossing a fair coin once.
(ii) A driver attempts to start a car. The car starts or does not start.
(iii) Rolling a fair 6-sided die.
(iv) Choosing a marble randomly from a bag that contains 3 red marbles and 7 blue marbles.
(v) A baby is born. It is a boy or a girl.
(i) Equally likely. A fair coin is symmetrical, giving Heads and Tails an exact 1/2 chance each.
(ii) Not equally likely. Starting a car depends on mechanical condition, fuel, and battery, not pure random chance. It is not a 50/50 probability.
(iii) Equally likely. A fair die is perfectly balanced, so each of the 6 faces has an exact 1/6 chance of landing face up.
(iv) Not equally likely. There are more blue marbles (7) than red marbles (3), so you are more likely to pick a blue marble.
(v) Equally likely. In simple probability models, it is generally assumed that the biological chance of a baby being a boy or a girl is practically equal (50/50).
Write the sample space and calculate the probability based on the given information.
(i) Two coins are tossed at the same time. What is the probability of getting at least one head?
Sample space
(ii) Ten identical cards numbered 1 to 10 are placed in a box. One card is drawn at random. What is the probability of drawing a card with an even number?
Sample space
(iii) A die is rolled once. What is the probability of getting a number greater than 4?
Sample space
(iv) A bag contains 3 red balls, 2 blue balls, and 1 green ball. One ball is picked at random. What is the probability that it is not red?
There are 6 balls total. The balls that are "not red" are the 2 blue and 1 green ball (3 outcomes). Probability = 3/6, which simplifies to 1/2.
(v) Three coins are tossed simultaneously. What is the probability of getting exactly two heads?
Sample space
End-Of-Chapter Exercises (Continued) (Pages 170-173)
A bag has 3 candies: strawberry, lemon, and mint. One is picked at random. What is the probability of picking a strawberry candy?
The sample space has 3 equally likely outcomes: {strawberry, lemon, mint}. There is exactly 1 favourable outcome (strawberry). The theoretical probability is 1/3.
A child has 2 shirts (one red and one blue) and 3 types of pants (jeans, khakis, and shorts). List all the possible combinations of outfits consisting of one shirt and one pair of pants. Display your answer in a table format.
To find all possible combinations, we pair every shirt with every pair of pants.
| Shirt | Pants |
|---|---|
| Red | Jeans |
| Red | Khakis |
| Red | Shorts |
| Blue | Jeans |
| Blue | Khakis |
| Blue | Shorts |
A tyre company records distances before replacement in 1000 cases.
The company recorded the following data:
| Distance (km) | Number of cases |
|---|---|
| Less than 4000 | 20 |
| 4001 to 9000 | 210 |
| 9001 to 14000 | 325 |
| More than 14000 | 445 |
Find the probability that a randomly chosen tyre lasts: (i) Less than 4000 km.
(ii) Between 4000 and 14000 km.
(iii) More than 14000 km.
The total number of cases (trials) is 1000.
(i) The number of cases less than 4000 km is 20. Probability = 20/1000, which simplifies to 0.02 (or 2%).
(ii) "Between 4000 and 14000 km" includes the "4001 to 9000" category and the "9001 to 14000" category. We add those together: 210 + 325 = 535 cases. Probability = 535/1000, which is 0.535 (or 53.5%).
(iii) The number of cases more than 14000 km is 445. Probability = 445/1000, which is 0.445 (or 44.5%).
The letters of the word 'PEACE' are placed on cards. Leela draws a card without looking.
(i) What is the probability that it is a P, E or C?
(ii) What is the probability that it is not an E?
There are 5 cards in total representing the letters P, E, A, C, E.
(i) The favourable outcomes are picking P, E, E, or C. There are 4 favourable outcomes. Probability = 4/5.
(ii) The cards that are "not E" are P, A, and C. There are 3 favourable outcomes. Probability = 3/5.
A game of chance consists of spinning an arrow (see Fig. 7.7.) which comes to rest pointing at one of the numbers 1, 2, 3, 4, 5, 6, 7, 8, and these are equally likely outcomes. What is the probability that it will point at:
(i) 8?
(ii) An odd number?
(iii) A number greater than 2?
(iv) A number less than 9?
(v) A multiple of 3?
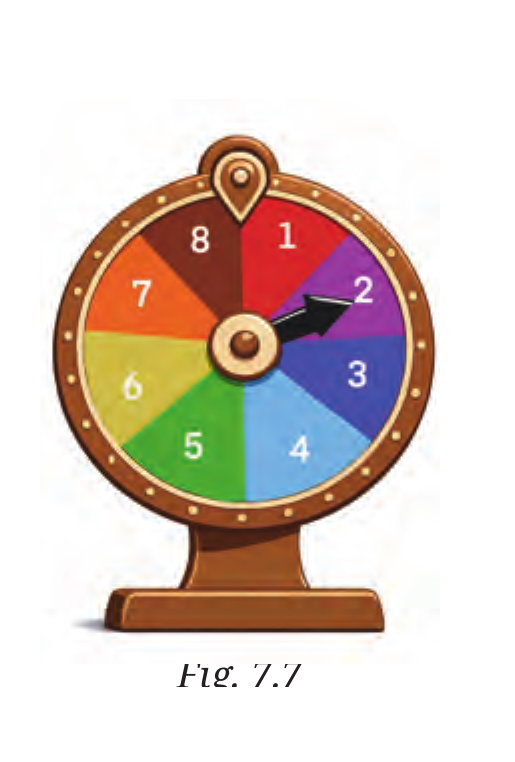
The sample space is {1, 2, 3, 4, 5, 6, 7, 8}. There are 8 possible equally likely outcomes.
(i) There is only one section labelled 8. Probability = 1/8.
(ii) The odd numbers on the spinner are 1, 3, 5, 7. This is 4 outcomes. Probability = 4/8, which simplifies to 1/2.
(iii) The numbers greater than 2 are 3, 4, 5, 6, 7, 8. This is 6 outcomes. Probability = 6/8, which simplifies to 3/4.
(iv) All 8 numbers on the spinner are less than 9. Probability = 8/8, which equals 1 (a certain event).
(v) The multiples of 3 on the spinner are 3 and 6. This is 2 outcomes. Probability = 2/8, which simplifies to 1/4.
A basket contains 4 red balls and 5 blue balls. One ball is drawn and laid aside, and a second ball is drawn. Draw a tree diagram to represent the possible outcomes and probabilities. Use the tree diagram to answer the following questions.
(i) What is the probability of drawing a red ball and then a blue ball?
(ii) What is the probability of drawing 2 blue balls?
There are 9 balls in total. Because the first ball is laid aside, it is not replaced, meaning the total number of balls for the second draw is reduced to 8.
Tree Diagram Description: 1. Start from a single point. Draw two branches for the first draw: Red (probability 4/9) and Blue (probability 5/9). 2. From the first Red branch, draw two more branches for the second draw: Red (probability 3/8, since one red is gone) and Blue (probability 5/8). 3. From the first Blue branch, draw two more branches for the second draw: Red (probability 4/8) and Blue (probability 4/8, since one blue is gone).
(i) To find the probability of the Red then Blue path, we multiply the probabilities along those specific branches:
(ii) To find the probability of drawing 2 blue balls (Blue then Blue), multiply along that path:
I throw a pair of 6-sided dice. Write down an event that has a probability of 0 and an outcome that has a probability of 1.
- When throwing two 6-sided dice, the lowest possible sum is 2 (1+1) and the highest possible sum is 12 (6+6).
- Probability of 0 (Impossible event): "Rolling a total sum of 15."
- Probability of 1 (Certain event): "Rolling a total sum between 2 and 12 inclusive."
Write the sample space and calculate the probability based on the given information.
(i) Two dice are rolled. What is the probability that the sum is a prime number greater than 5?
- The total number of outcomes for two dice is
6 × 6 = 3 6 - Sum of 7 can be rolled as: (1,6), (2,5), (3,4), (4,3), (5,2), (6,1) — 6 ways.
- Sum of 11 can be rolled as: (5,6), (6,5) — 2 ways. Total favourable outcomes = 8. Probability = 8/36, which simplifies to 2/9.
- (ii) A bag contains 4 red, 3 green, and 2 blue balls. Two balls are drawn without replacement. What is the probability that both are of different colours? There are 9 balls in total. It is easier to calculate the probability of picking the same colour first, and then subtract that from 1.
- Probability of Red, Red:
( 4 / 9 ) × ( 3 / 8 ) = 1 2 / 7 2 - Probability of Green, Green:
( 3 / 9 ) × ( 2 / 8 ) = 6 / 7 2 - Probability of Blue, Blue:
( 2 / 9 ) × ( 1 / 8 ) = 2 / 7 2 ( 1 2 + 6 + 2 ) / 7 2 = 2 0 / 7 2 1 − ( 2 0 / 7 2 ) = 5 2 / 7 2 - (iii) Three coins are tossed. What is the probability that the first coin shows heads and exactly two heads occur in total? Sample space
𝑆 = { H H H , H H T , H T H , H T T , T H H , T H T , T T H , T T T } - (iv) A four-digit number is formed using the digits 1, 2, 3, and 4 with no repetition. What is the probability that the number is even? For a number to be even, it must end in 2 or 4.
- Total possible 4-digit numbers =
4 × 3 × 2 × 1 = 2 4 - If the number ends in 2, the first three digits can be arranged in
3 × 2 × 1 = 6 - If the number ends in 4, the first three digits can also be arranged in 6 ways. Total even numbers = 12. Probability = 12/24 = 1/2.
- (v) A student takes a multiple-choice test with 3 questions, each having 4 options (A, B, C, D), with only one correct answer. What is the probability that the student guesses and gets exactly 2 answers correct? Each question has a 1/4 chance of being correct (C) and a 3/4 chance of being wrong (W). "Exactly 2 correct" means the pattern is CCW, CWC, or WCC.
- Probability of CCW =
( 1 / 4 ) × ( 1 / 4 ) × ( 3 / 4 ) = 3 / 6 4 3 × ( 3 / 6 4 ) = 9 / 6 4
A box contains 4 balls numbered 1 to 4. Record a sample space using a tree diagram for the following experiments:
(i) A ball is drawn, and the number is recorded. Then the ball is returned, and a second ball is drawn and recorded.
(ii) A ball is drawn and recorded. Without replacing the first ball, the experimenter draws and records a second ball.
(iii) What are the sizes of these two sample spaces?
(i) Tree Diagram Description (With Replacement): First draw has 4 branches (1, 2, 3, 4). Because the ball is returned, from each of these 4 branches, we draw 4 more branches for the second draw (1, 2, 3, 4).
(ii) Tree Diagram Description (Without Replacement): First draw has 4 branches (1, 2, 3, 4). Because the ball is NOT returned, from branch '1', we draw 3 branches (2, 3, 4). From branch '2', we draw 3 branches (1, 3, 4), and so on.
(iii) The size of the sample space for part (i) is
List the elements of a sample space for the simultaneous tossing of a coin and drawing of a card from a set of 6 cards numbered 1 through 6.
The coin has outcomes {H, T}. The cards have outcomes {1, 2, 3, 4, 5, 6}. Combining them systematically gives the sample space:
Three coins are tossed, and the number of heads is recorded. Which of the following lists is a sample space for this experiment? Why do the other lists fail to qualify as a sample space?
(i) {1, 2, 3} (ii) {0, 1, 2} (iii) {0, 1, 2, 3, 4} (iv) {0, 1, 2, 3}
- The correct list is (iv) {0, 1, 2, 3}. This is because when tossing three coins, you can get exactly 0 heads, 1 head, 2 heads, or 3 heads.
- List (i) fails because it is missing the possible outcome of getting 0 heads (TTT).
- List (ii) fails because it is missing the possible outcome of getting 3 heads (HHH).
- List (iii) fails because it includes 4, which is an impossible outcome when you are only tossing 3 coins.
Suppose you drop a dye at random on the rectangular region shown in Fig. 7.8. What is the probability that it will land inside the circle with a diameter of 1 m?
- The probability is calculated by comparing the areas.
- First, find the total area of the rectangular region:
3 m × 2 m = 6 s q u a r e m e t e r s - Next, find the area of the circle. The diameter is 1 m, so the radius is 0.5 m. Area of circle =
𝜋 × 𝑟 2 = 𝜋 × ( 0 . 5 ) 2 = 0 . 2 5 𝜋 s q u a r e m e t e r s - The probability is the area of the circle divided by the total area:
0 . 2 5 𝜋 / 6 𝜋 / 2 4